

The week of November 2 started off calmly enough, then stocks staged a big rally on Wednesday, November 4, after the midterm elections, with the Democrats taking over both the House and Senate and doing much better than expected. The initial pop was likely relief that the election was simply over and we could move on, not to mention that historically stocks have done well once midterms were out of the way.
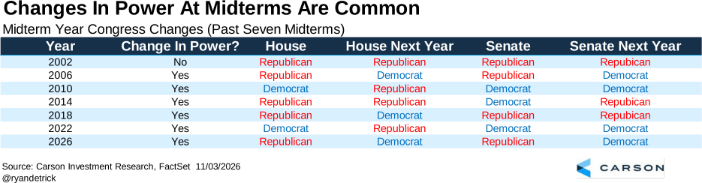
Let’s be clear that changes in power in Congress are quite common, as this is now the sixth midterm in a row to see a change in power. It was the size of the Blue Wave that likely caught the market off guard. Which brings us to Thursday.
Then came a red wave of selling
Like clockwork, right at 10am ET on Thursday, November 5, massive selling started, and in the end it was one of the worst days we’ve seen in years, down a whopping 4.4%. Although all major sectors were lower on the day, the majority of the selling was focused in technology, as that group fell 8% and semiconductors fell 12% for their second-worst day ever (only March 2020 was worse). Rumors of forced selling and funds going under dominated the conversation, but the bottom line was a red wave of selling.
What sparked it? The realization that voters nearly unanimously rejected building more datacenters was front and center. According to CBS, 44 of 45 ballot measures placing some kind of limit on datacenters at a state or local level passed. Ohio alone had 21 datacenter ballot measures, and every single one was approved by voters. As we discuss below, AI and datacenter construction has been a major driver of economic growth, and in turn markets, in the past two years, and justified or not the voter reaction led to a sell-first-and-ask-questions-later mentality from investors.
The toll we pay to invest
After Wednesday’s big rally, the S&P 500 was about 1.5% away from a new high, and the S&P 500 equal-weight index closed at an all-time high. Things looked pretty good, and then the volatility happened. Long-time readers know we like to say that volatility is the toll we pay to invest, and we all paid that toll on Thursday.
This is only the second 5% mild pullback of the year, which really puts in context how things have gone this year. We had the 9.1% correction in February and March around the start of the Iran war, then a historic jump in April and May, only to be followed by a very boring market. In fact, from the end of May until the end of October, the S&P 500 was basically flat, and the three months going into November traded in only a 3.5% range, one of the tightest three-month ranges in history.
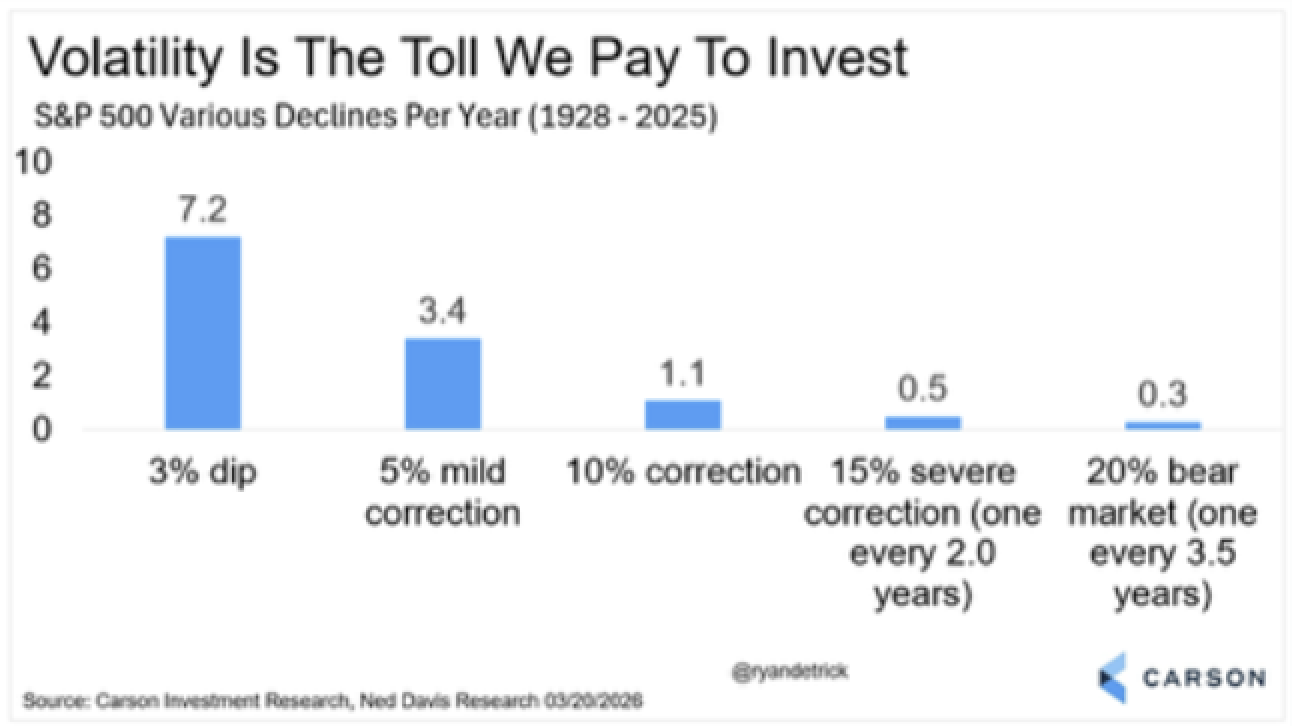
You could argue we were due for some volatility, and it sure happened. There’s an old saying that goes “the stock market takes an escalator up and an elevator down,” and it played out in a big way here. Below is a chart we’ve shared for years, and after last week we wanted to share it again. Each year has volatility and scary headlines, so 2026 wasn’t going to be any different. On average, the S&P 500 has more than three separate 5% mild pullbacks and one 10% correction a year, with a bear market occurring every 3.5 years. In order to benefit from the incredible long-term gains the stock market provides, we have to pay the toll of experiencing all the ups and downs.
In a bear market, trouble historically starts fast
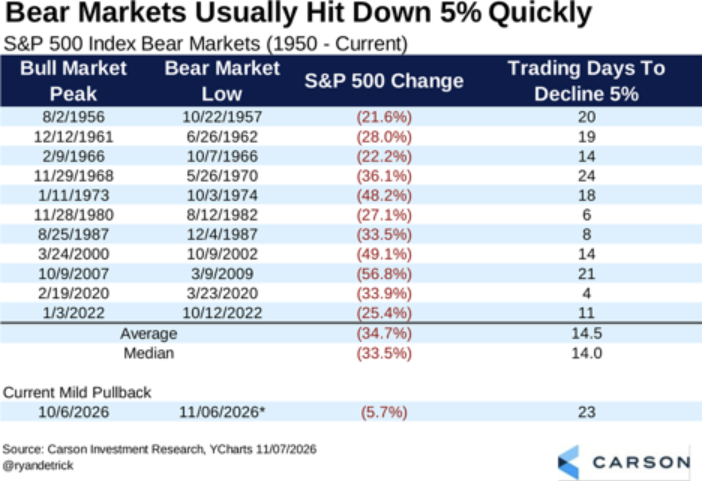
The last all-time high for the S&P 500 was on October 6, and it officially moved into a 5% mild correction on Thursday, 23 trading days from an all-time high to down 5%. In late March, which also saw a slow initial 5% correction, we noted this as a reason not to expect a bear market (which proved correct), and we are sharing it again. Looking at previous bear markets, you tend to see that initial 5% decline happen quickly. If it takes a long time to be down 5%, then the odds of moving into a bear market are slim.
Only one bear market took longer to be down 5% than the current decline, and that was the 34% bear market of the late ’60s and early ’70s, at 24 days. The average was 14.5 days to be down 5%, and this could be a clue that although this volatility isn’t fun, going into a bear market from here isn’t likely.
Reminder: The stock market is more than just AI
The massive selloff on Thursday does have everyone worried about technology stocks after the blue tsunami on Election Day. Thursday’s selloff more than erased the large post-election gains. But look at the two-day return on Wednesday and Thursday, not even including Friday’s small bounce:
- S&P 500: -2.8%
- Nasdaq: -4.2%
- Dow Jones Industrial Average (Dow): -0.5%
That performance differential between the Dow and Nasdaq tells you a lot about this market. And it’s not just a two-day phenomenon. Since the Nasdaq peaked on October 6:
- S&P 500: -5.6%
- Nasdaq: -10.9% (a “correction”)
- Dow: -0.4%
The Nasdaq is in correction territory, while the Dow has been almost flat. That’s a big divergence.
Concentration’s a problem
When we talk about the “stock market,” we’re usually referring to the S&P 500. Historically, that’s made sense because it’s been a broadly diversified index.
The problem is that it’s not so diversified anymore. Consider the concentration of the 10 largest stocks in the S&P 500 today versus December 1999, near the peak of the dot-com bubble.
- In December 1999, the top 10 stocks accounted for 25% of the index. Four were non-tech companies, spanning industrials, retail, energy, and banking, while technology names accounted for 15%.
- Today, the top 10 account for a whopping 39% of the index, with eight technology-related names making up 35%. The other two are a pharmaceutical company and a diversified holding company.
In our opinion, that’s a massive difference.
It’s not just the largest stocks. Technology and communication services together account for 46% of the S&P 500 today, versus 37% in December 1999. Meanwhile, financials, healthcare, and energy make up just 26%.
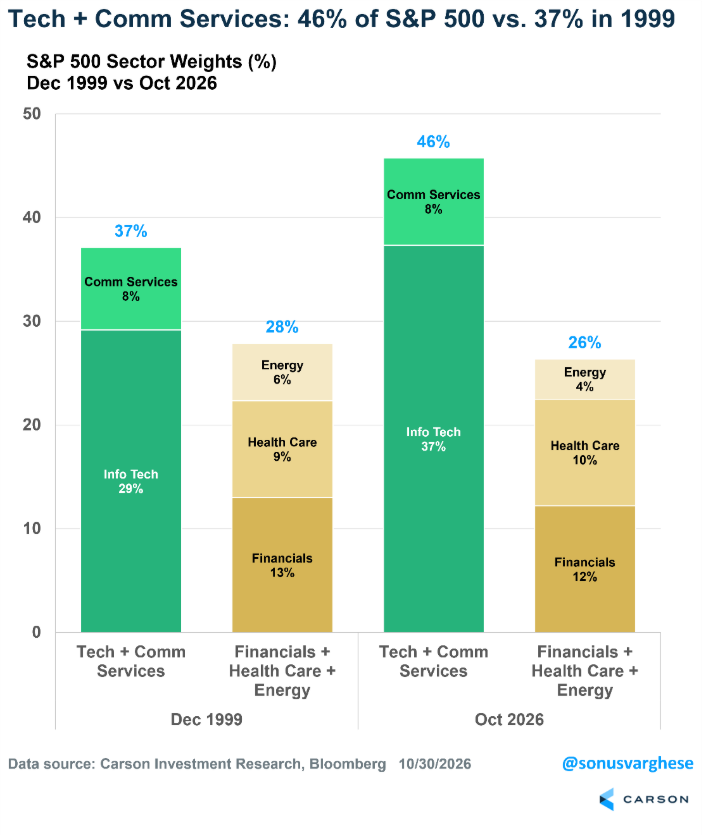
In short, we have a lot of concentration, and when technology stocks take an outsized hit, so does the S&P 500. But here’s the thing: You don’t have to invest in the stock market exactly the way the S&P 500 is constructed. You can be more diversified than the index. Recent market action beyond the headline indices also shows why that matters.
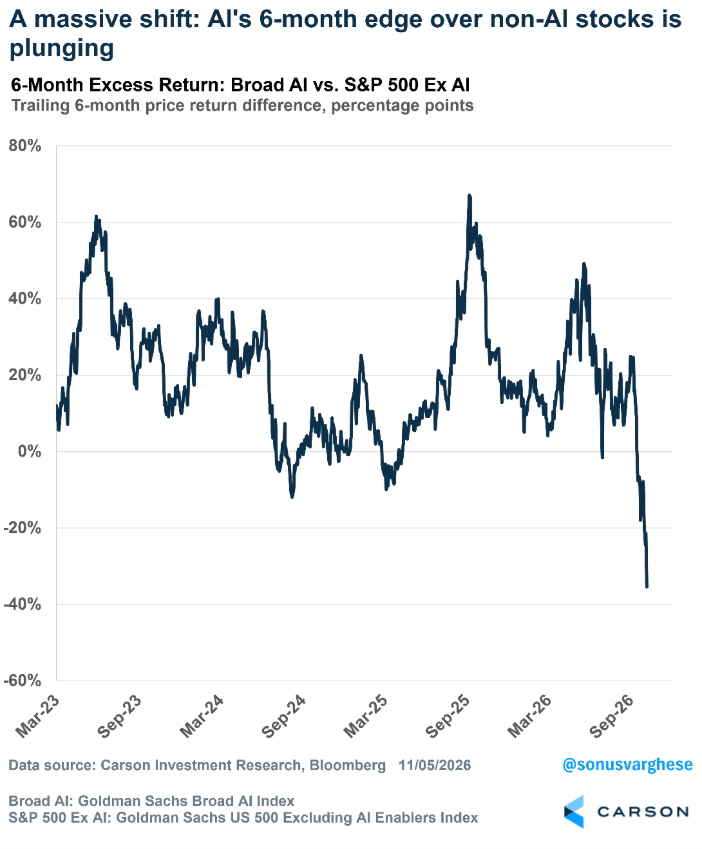
It’s one thing for non-AI stocks to outperform AI stocks for a week or two. But this rotation has been going on for a while. Consider the performance of AI versus non-AI stocks over rolling six-month periods. The differential is now the worst we’ve seen during this four-year bull market. Over the past six months (data via Bloomberg):
- The Goldman Sachs Broad AI Index (“AI stocks”) is down 24.5%.
- The S&P 500 Ex AI Enablers Index (“Non-AI stocks”) is up 10.9%.
- A performance differential of 35.4%.
Back on October 6, AI stocks were outperforming non-AI stocks by 25 percentage points, and on June 18 the outperformance was 49 percentage points. We believe that is an extraordinary reversal.
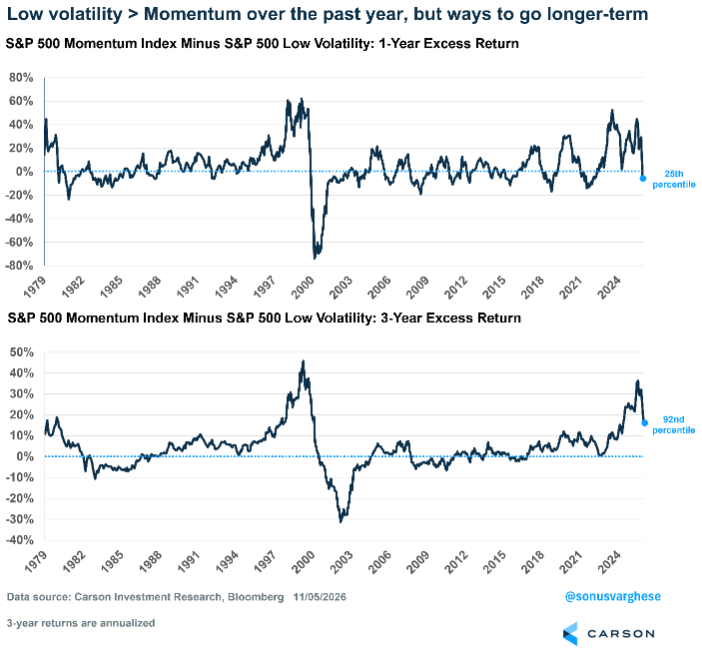
Another way to see this rotation is by comparing momentum stocks with low-volatility stocks, which are about as “anti-AI” as you can get.
- The one-year excess return of the S&P 500 Momentum Index over the S&P 500 Low Volatility Index has fallen to the 25th percentile historically, versus the 96th percentile in June.
- But here’s what’s interesting: The three-year excess return is still in the 92nd percentile, down from the 99th percentile in June. The three-year outperformance remains greater than anything we saw between February 2001 and April 2025.
If this is the start of a sustained rotation, there’s potentially a long way to go. We’ve been writing about the benefits of barbelling technology/momentum exposure with low-volatility stocks since our full-year 2026 Outlook, and again in our Midyear Outlook.
That’s not to say technology stocks can’t come roaring back. They certainly could, and the S&P 500 could rally alongside them. But given the index’s concentration, a broad market recovery would be heavily dependent on technology rebounding. Should you bet on that, and consider this a “buying opportunity”? Maybe, maybe not. The important point is that you don’t have to rely entirely on the AI wave continuing, with all the optimistic projections that come with it.
Of course, if you’re looking beyond AI stocks, there’s another important question: What about the economy? There’s good news here, too.
The economy is more than AI
Remember all those predictions about an AI-driven jobs apocalypse? We’re several years into AI deployment across the economy, and the labor market has actually gotten better this year. Some numbers:
- Employers added 165,000 jobs in October, taking the three-month average to 137,000. Monthly job growth has averaged 86,000 this year, a significant recovery from the average loss of 7,000 jobs per month between May and December 2025.
- The unemployment rate is at a historically low 4.1%, and it’s been below 4.5% for a record five straight years.
- The prime-age employment-population ratio is at 80.7%, higher than anything we saw in the 2000s or 2010s economic expansions. More people in their prime working-age years are working now than at any point during the last two expansions.
- The layoff rate (layoffs as a percent of the workforce) is just 1%, even lower than the 1.2-1.3% we saw in 2018-2019, when the labor market was exceptionally strong.
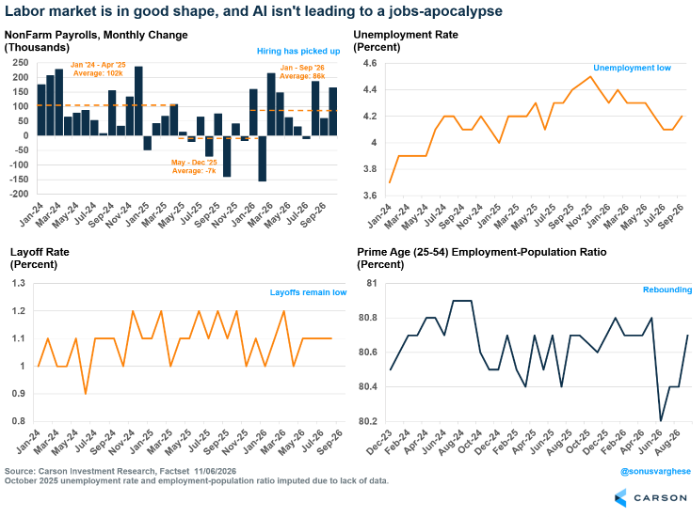
This doesn’t mean everything is rosy. Finding a job is still difficult, with the average unemployed jobseeker out of work for more than 27 weeks, the longest since 2021. But the big picture is that the labor market is recovering from a difficult stretch last year. The economy is doing just fine, even beyond the massive investment spending on AI infrastructure.
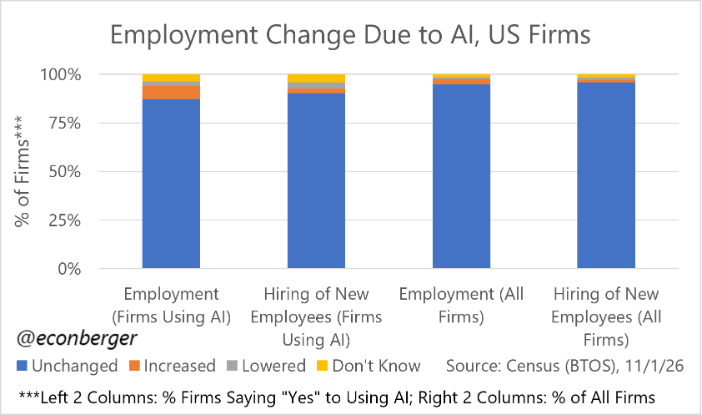
And despite all the predictions, AI doesn’t appear to be having much impact on employment yet. Economist Guy Berger recently highlighted Census data showing how firms are changing employment and hiring because of AI:
- Among firms using AI, 87-90% report no change.
- Among all firms, at least 95% report no change.
So what exactly is AI doing to the economy beyond the enormous infrastructure buildout?
- At best, AI is being deployed as a tool and boosting productivity.
- At worst, it’s having minimal impact on employment so far.
That also raises questions about projections for explosive AI demand driven by replacing workers. In May 2025, the CEO of a leading AI developer predicted AI could eliminate half of entry-level white-collar jobs by the end of the decade. We’re now 18 months from when that prediction was made, and the labor market has improved.
None of this tells us where AI ultimately goes. But it does tell us that the economy is more than just AI, just as the stock market is more than a handful of technology stocks. And that’s important for investors.
You don’t have to play that game
There are two risks we’re facing right now. First, AI could be a bubble, and the recent volatility may signal that we’re getting closer to its end. Second, the S&P 500 is so concentrated in technology that investors are taking on enormous exposure to that single theme, whether they realize it or not.
The good news is that you don’t have to play that game.
Back in late June, when AI and momentum stocks were really extended, we wrote about learning to “stop worrying and love the bubble.” The same thought still applies.
We have no idea what stage of the bubble we’re in, or when it might pop. But rather than trying to perfectly time the top and get out before everyone else (good luck with that), we’re increasingly comfortable judiciously diversifying outside AI, even if it means missing some upside. We believe being diversified, even within equities (especially within equities), is more important than ever.
S&P 500 — A capitalization-weighted index of 500 stocks designed to measure performance of the broad domestic economy through changes in the aggregate market value of 500 stocks representing all major industries.
The NASDAQ 100 Index is a stock index of the 100 largest companies by market capitalization traded on NASDAQ Stock Market. The NASDAQ 100 Index includes publicly traded companies from most sectors in the global economy, the major exception being financial services.
The views stated in this letter are not necessarily the opinion of Cetera Wealth Services LLC and should not be construed directly or indirectly as an offer to buy or sell any securities mentioned herein. Investors cannot invest directly in indexes. The performance of any index is not indicative of the performance of any investment and does not take into account the effects of inflation and the fees and expenses associated with investing.
A diversified portfolio does not assure a profit or protect against loss in a declining market.
All investing involves risk, including the possible loss of principal. There is no assurance that any investment strategy will be successful. This information is from sources believed to be reliable, but Cetera Wealth Services, LLC cannot guarantee or represent that it is accurate or complete.
9227365.1-1126-C
